
Melanie Fewings is no stranger to the elegance of moving water. She grew up on Salt Spring Island in British Columbia, poking around tide pools and learning about the region’s crustaceans and other creatures. She was also good at math, later learning equations that explain how water moves with such grace. But it wasn’t until after her master’s degree that Fewings combined physics and the marine world to become a physical oceanographer.
Putting physics and oceanography together was a little serendipitous for Fewings. During her master’s program in applied physics at Cornell, she studied non-linear optics and learned how to build a laser. Soon after, she came across a website about the NASA Coastal Zone Color Scanner satellite. The project featured the first satellite instrument devoted to the measurement of ocean color. A swirling panoply of hues revealed an ocean she had never seen before.
“It was so beautiful. There were all these rainbow-colored maps and diagrams,” she says. “I saw those images and said to myself, ‘I think I want to be an oceanographer.’”
Fewings eventually earned her Ph.D. in physical oceanography in the Woods Hole Oceanographic Institution/Massachusetts Institute of Technology Joint Program. She has since studied how the coastal ocean and atmosphere interact, the complicated dance of air and sea that shapes everything from weather to marine food webs. She has developed methods of using long time series data from satellites, underwater moorings and weather buoys to study the oceans and atmosphere, from the coast to thousands of kilometers offshore.
“I’ve always been greedy for data,” she admits.
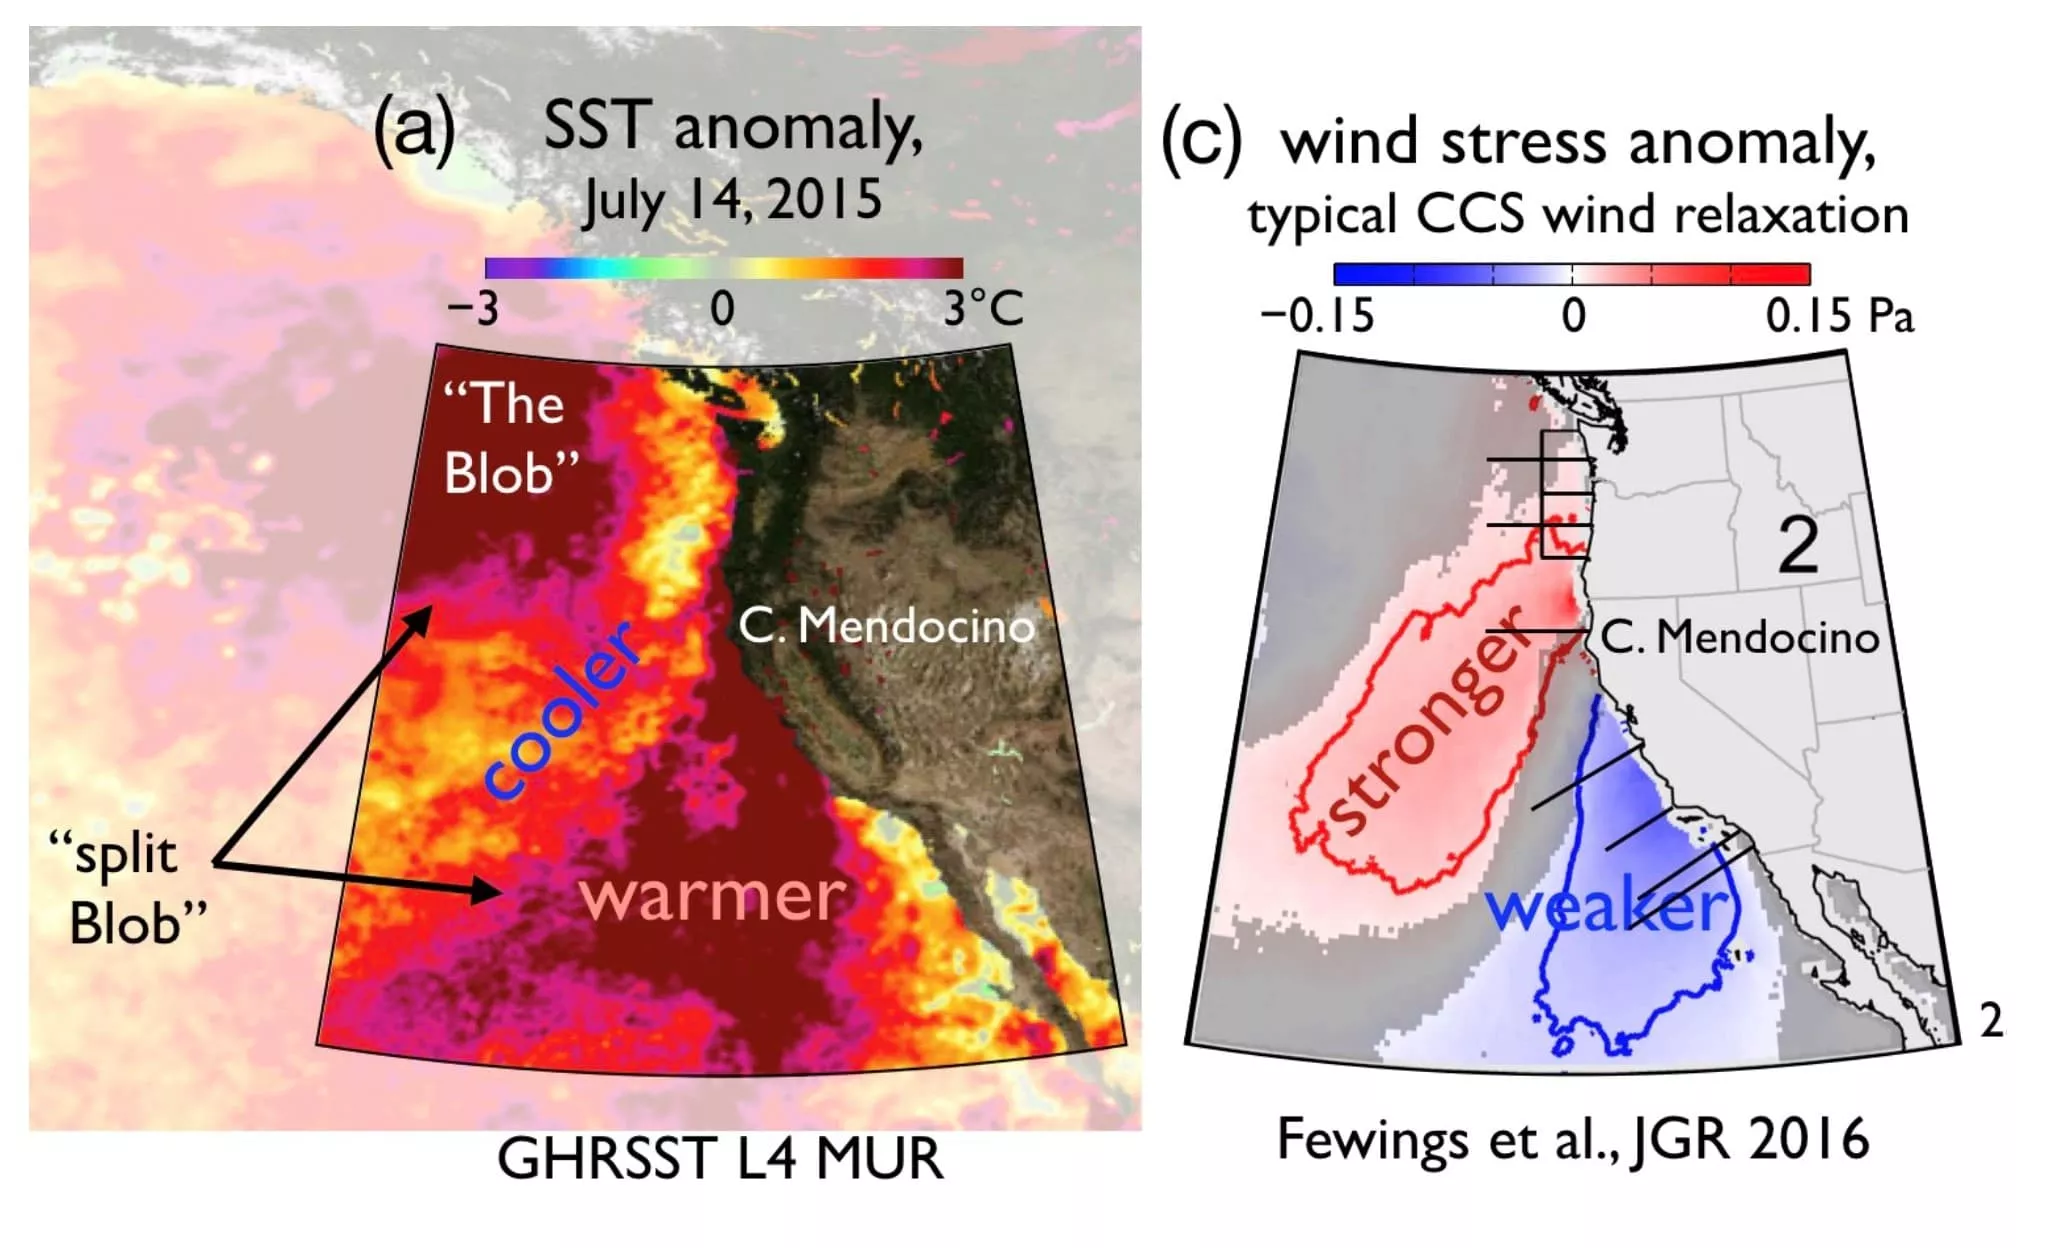
One of Fewings’ recent projects investigates the marine heat wave (MHW) of 2014-16 (informally known as the Blob) that brought unusually warm water to the northeastern Pacific. The warm water disrupted coastal upwelling that normally brings nutrients to the surface and fuels ocean life. It was linked to myriad disturbances, from marine mammal die-offs to harmful algal blooms that impacted commercial fisheries. Similar warm water episodes also occurred in 2018.
When this marine heat wave may recur is unclear. But scientists are closer to understanding where it will appear. Fewings has been examining whether and how wind has influenced the spatial pattern of the Blob. She suspected a relationship when she noticed that the pattern of the winds and marine heat wave shared some similarities.
First, both exhibited a split structure. California’s coastline shape, specifically its signature eastward bend at Cape Mendocino, causes what Fewings calls a wind dipole that splits the winds into two parts. When winds along the northern part of the coastline weaken, the southern half often experiences stronger winds, and vice versa. These alternating wind intensifications and relaxations typically last between two and five days. Interestingly, about mid-way through 2015, the marine heat wave also split into two parts, one in the Gulf of Alaska and one south of the Oregon-California border.
The marine heat wave and the wind pattern shared another peculiar parallel. The abnormal heat off central California was shaped like a triangle, which was very similar to the shape of the southern half of the wind dipole.
Could the wind pattern have influenced the pattern of the marine heat wave?
To find out, Fewings examined satellite data, which showed that winds off California were weakened for a two-week period immediately preceding the marine heat wave split, a period much longer than the two to five days of weakened winds seen in a typical year. Fewings hypothesized that this extended relaxed wind pattern explained the marine heat wave’s split structure. Her group’s case study of the event supports this idea, underscoring the importance of examining winds and temperature simultaneously.
Fewings was able to further investigate wind as a major influence on the marine heat wave by calculating a heat budget for the surface ocean off the western continental U.S. She says to think of the upper ocean like a bank account for heat. Evaporation, sunshine and other sources of heat flux either add or take away from the balance. By looking at the transactions immediately preceding the marine heat wave split, Fewings and her collaborators discovered an imbalance.
“We looked at the deposits and withdrawals of heat by the air-sea interactions accumulated over the two weeks prior to the marine heat wave split. That’s when we saw there had been mysterious activity, a balance you can’t account for with the most obvious culprits,” she said. “What we’ve shown for this region is that the exchange of heat between the ocean and atmosphere, including changes in sunshine, were making nearly their normal contributions to the budget, and yet we still had all this extra heat. Where did it come from?”
The next obvious culprit in her heat budget investigation was ocean currents, but currents alone could not explain the abnormal warming. This left only changes in wind and associated vertical mixing of cold water as a possible explanation. The unusually long relaxed wind apparently brought less cold water to the surface from the deeper ocean, allowing the warm water to accumulate off California. “The persistently relaxed wind was like saving a little bit every day for an extended length of time. Eventually you’re going to build up a large extra amount,” she explained.
Fewings’ research will help coastal managers and scientists anticipate where the warm water may appear in the future. She and her collaborators are already beginning to examine the connection between winds and sea surface temperatures in other eastern ocean boundary upwelling systems, including Chile-Peru and Benguela. And because marine heat waves are becoming more common globally, predicting their spatial expression will be key to understanding their impacts – both to our economy and to our ecosystem.
Posted August 14, 2019
By Abby Metzger
See more feature stories and newer stories.