

Image
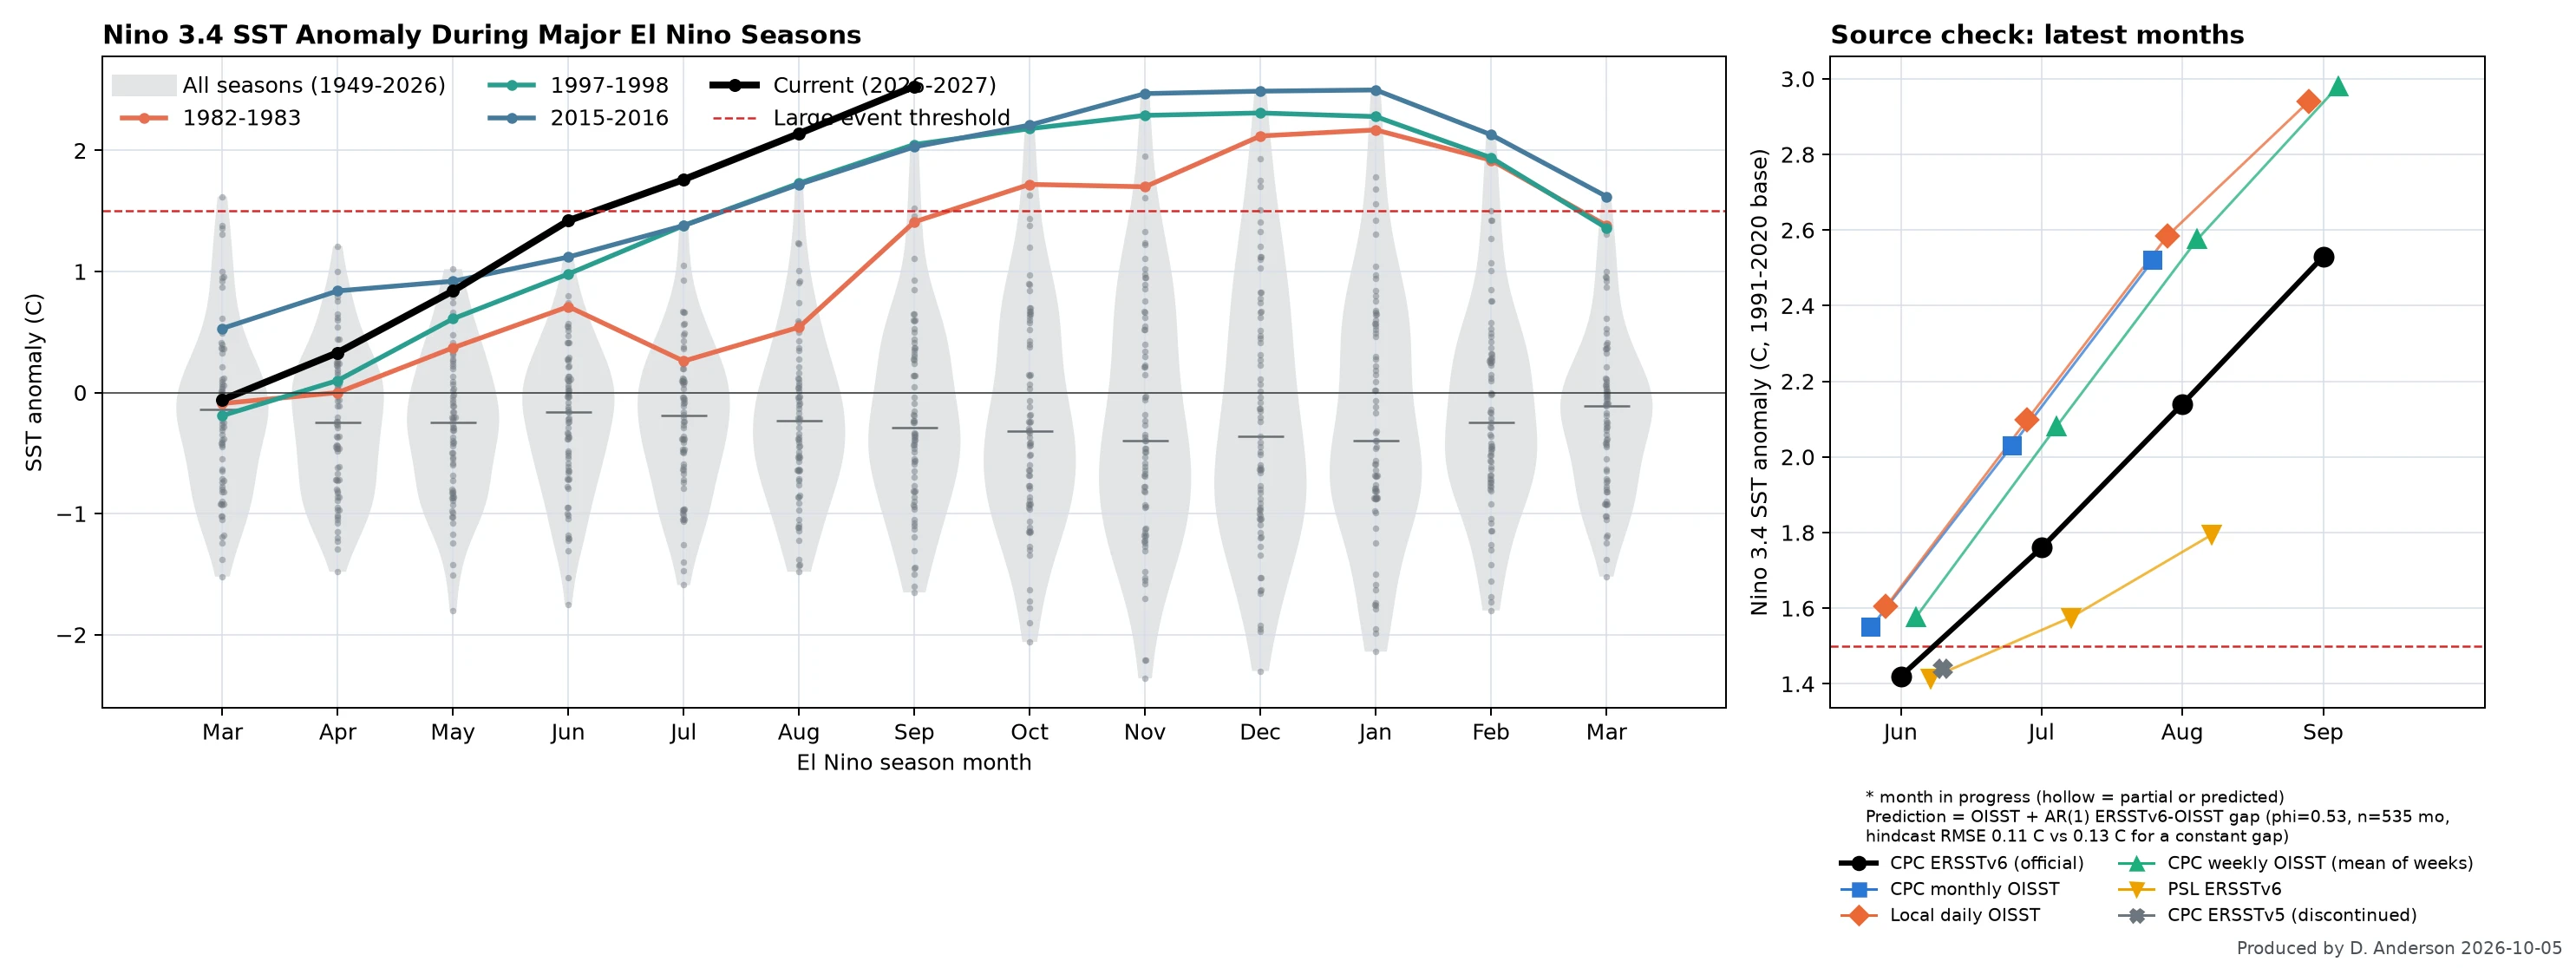
As we are faced with what is expected to be an extreme El Niño event, multiple research groups in CEOAS and coastal engineering are conducting field surveys to monitor the evolution of environmental parameters like ground elevation, water level, and runup. We are also synthesizing data from various agencies to compare the progression and intensity of this El Niño to past events. The plots from these analyses are shown below.
Fig 1. Comparison of sea surface temperature during current and previous El Niño seasons. Generated by Dylan Anderson.
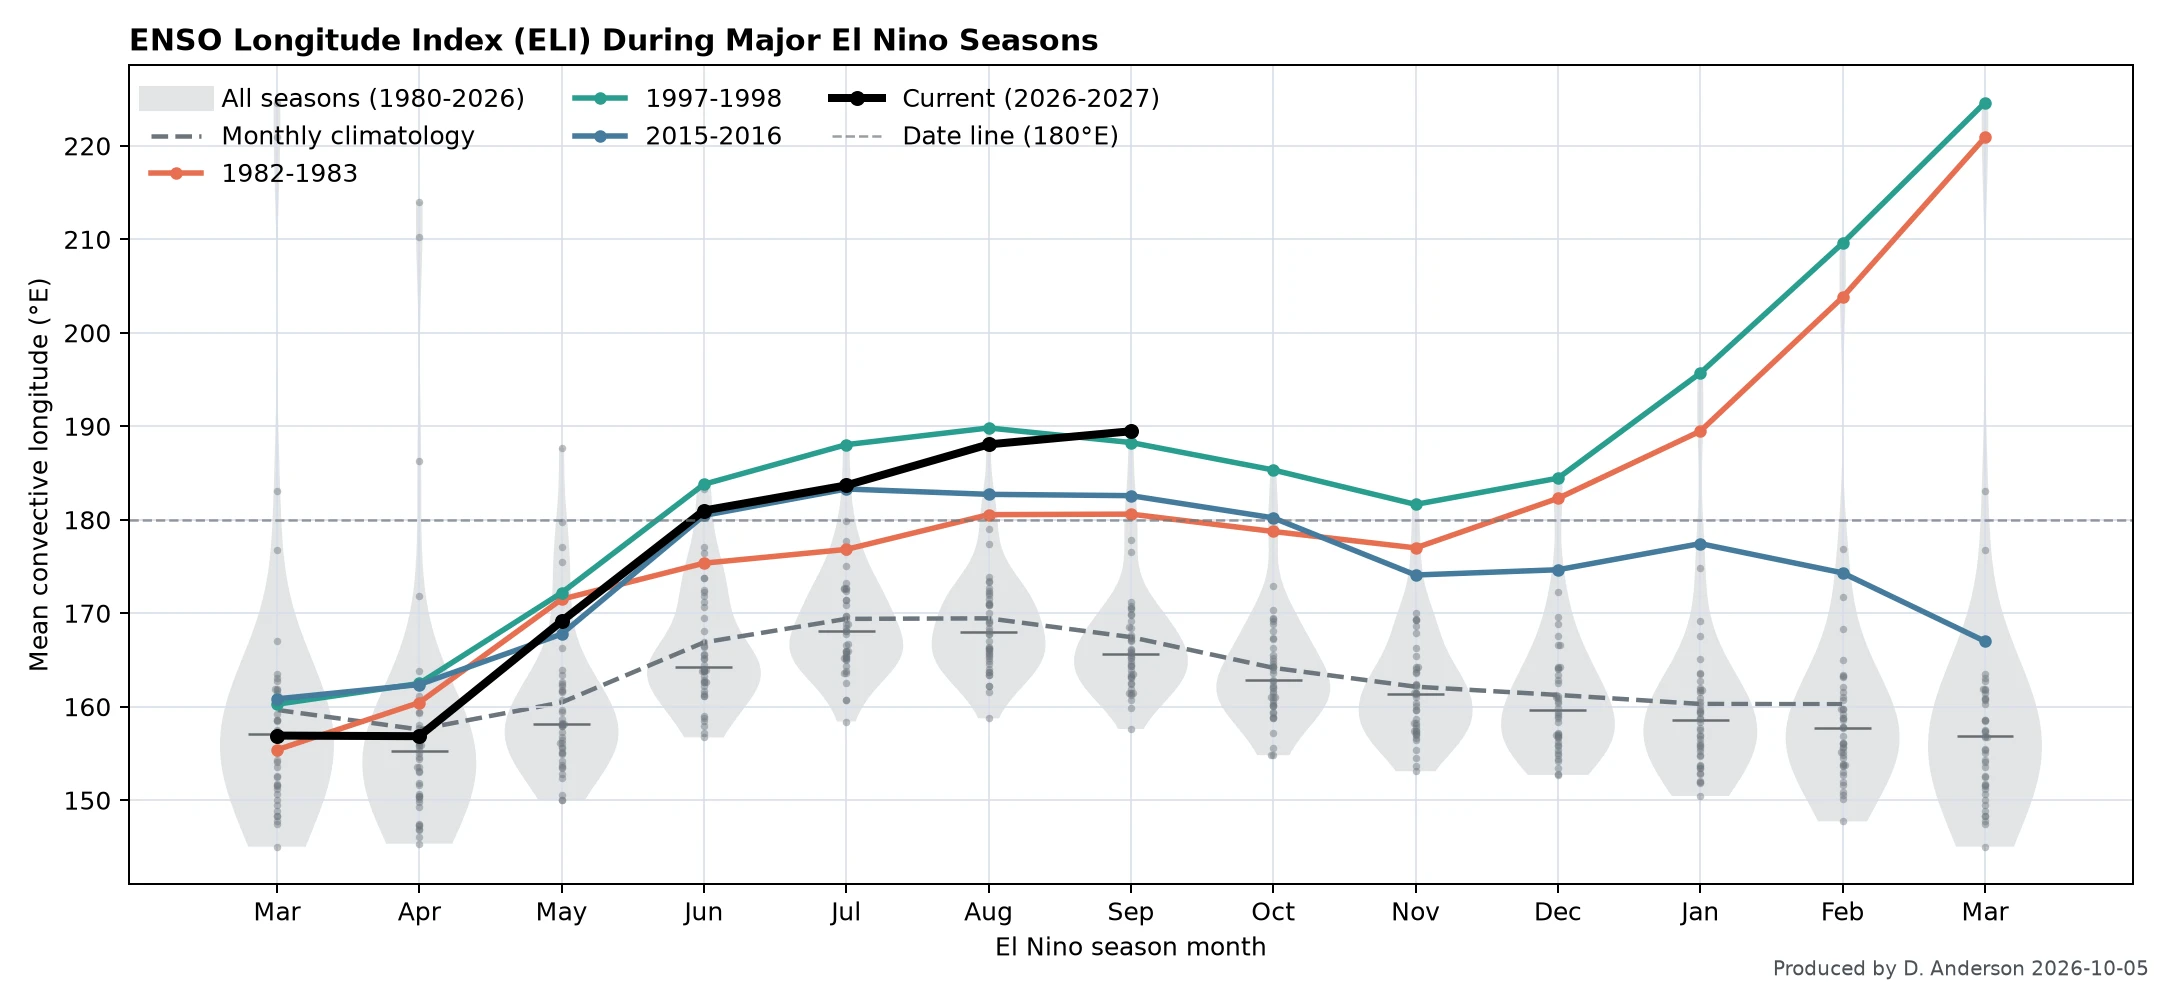
Fig 2. Comparison of ENSO Longitude Index during current and previous El Niño seasons. Generated by Dylan Anderson.

Fig 3. Comparisons current 30-day mean water level to that of previous El Niño events along the west Coast shown on the left. Corresponding present-day sea surface temperature anomalies shown on the right. Generated by Dylan Anderson.

Fig 4. Time series of alongshore wave power at buoys along the west coast alongside regional wave power sourced from ERA5. Generated by Dylan Anderson.

Fig 5. Comparison of current water level with mean sea level (MSL) datum and historical El Niño-driven sea level anomalies across west coast sites. Shown alongside current regional sea surface temperature (SST) anomalies (as of 09/30/26). Generated by Dylan Anderson.

Fig 6. Comparison of 30-day mean water level, mean runup, and their resulting total water level for September '26 window across west coast sites. Generated by Dylan Anderson.

Fig 4. Time series of monthly mean sea level for present and past El Niño seasons at sites throughout the west coast. Generated by Dylan Anderson.

Fig 5. Comparison of current cumulative alongshore wave energy in Stonewall Bank, OR to that of previous El Niño seasons. Generated by Dylan Anderson.