

Maybe you’ve heard about El Niño in the news lately, or maybe this recent media attention isn’t your first exposure to this climate concept. Either way, read on to satisfy your curiosity about what El Niño is and why the winter of 2026-27, which is already marked by a record-shattering El Niño, is likely to be a little wilder than normal.
What is El Niño?
El Niño is a natural climate phenomenon that occurs when trade winds weaken and unusually warm waters build in the tropical Pacific Ocean, leading to far-reaching impacts around the world. In the northern parts of the United States El Niño is often associated with a warmer and milder winter than normal, while the south experiences more intense rainfall.
The conditions for an El Niño – defined as increased sea surface temperatures +0.5 degrees Celsius above normal for an extended period – occur every two to seven years and last up to a year. The event usually peaks in December or January. The opposite phenomenon, La Niña, is characterized by cooler ocean conditions. Trade winds become stronger; more storms build in the western Pacific; and sea surface temperatures in the eastern Pacific drop. The tropical Pacific Ocean cycles between these warm and cold-water extremes, known as the El Niño-Southern Oscillation.
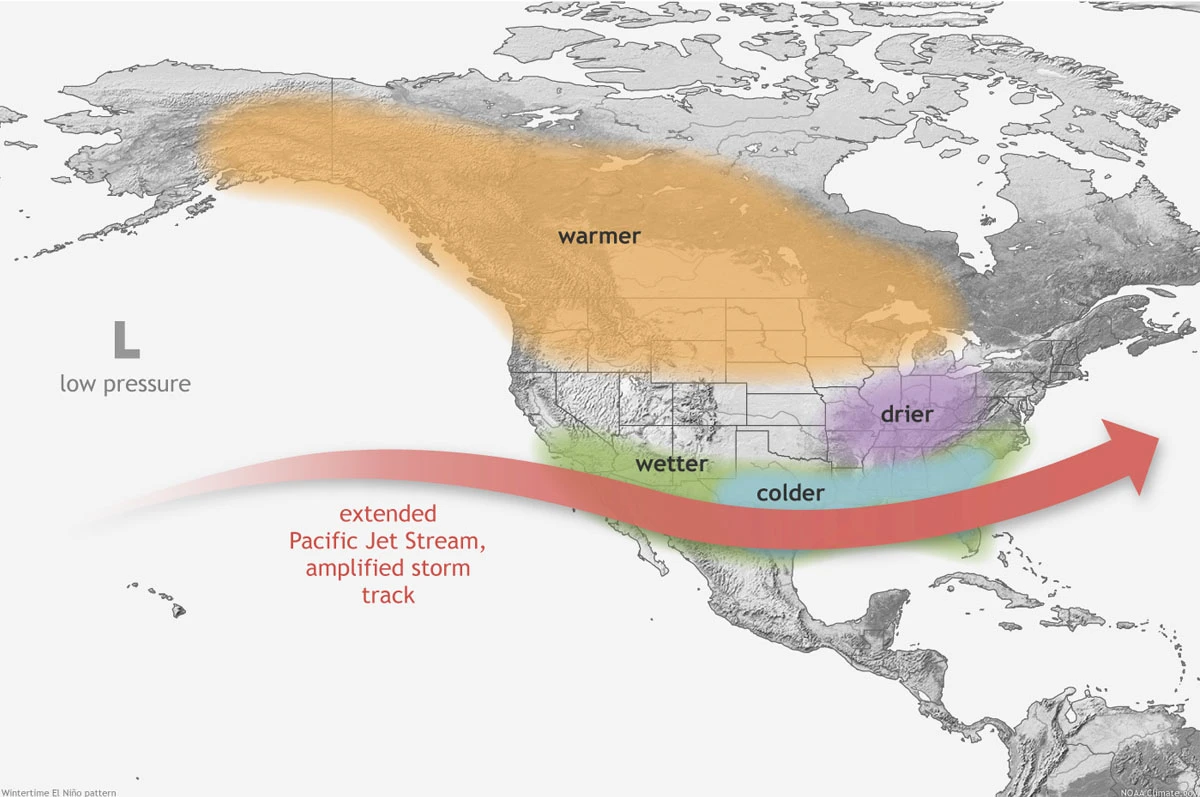
[Source: NOAA Understanding El Niño]
How do distant ocean temperatures change our weather at home so dramatically? Trade winds blow east to west, maintaining the cool waters in the eastern Pacific and warm waters in the western Pacific. When those winds begin to weaken or even reverse, warm waters move east, and the system feeds itself. The ocean and atmosphere are coupled, so heat and moisture from the ocean are transferred into the atmosphere. El Niño shifts the Pacific jet stream, altering where winter storms fall in the United States; it sends record rainfall to western South America; it plagues Australia and Indonesia with drought; and it fuels hurricanes in the eastern Pacific while suppressing storms in the Atlantic. Read the Oregon Climate Assessment chapter on the El Niño- Southern Oscillation.
How did El Niño get its name?
People have known about El Niño a long time. Accounts vary, but perhaps as far back as the 1600s Peruvian fishermen noticed that every few years warm water would bathe their fishing grounds, resulting in lower catches. Because that warm water mass arrived around Christmas, they named the phenomenon El Niño, the boy child.
What is special about El Niño 2026-27?
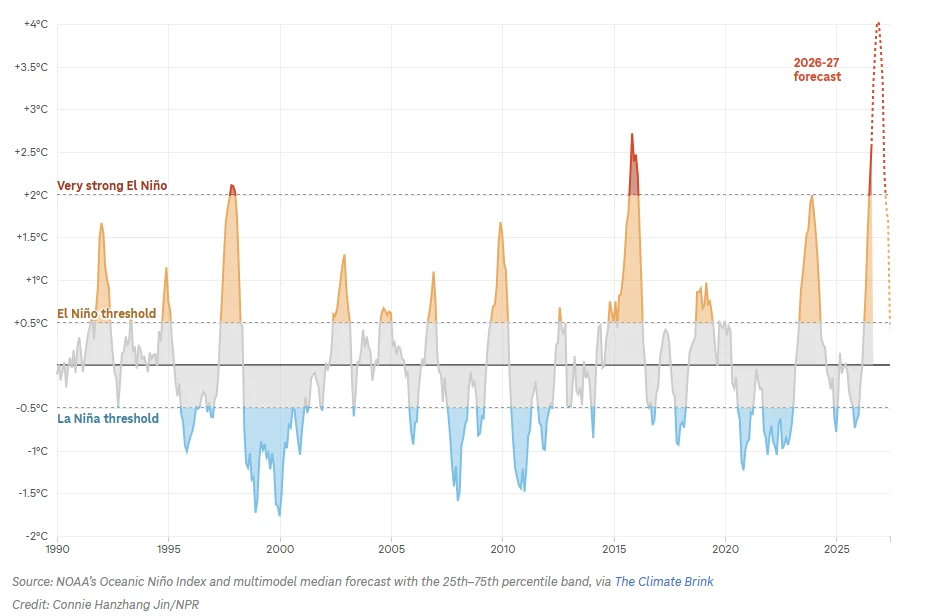
Each El Niño is categorized by its strength, or the temperature difference compared to average in the equatorial Pacific Ocean. This 2026 El Niño is a “very strong” El Niño, the strongest possible, marked by sea surface temperatures more than 2 degrees Celsius above average. Prior very strong El Niños occurred in 2015-16, 1997-98 and 1982-83, but this El Niño is likely to be the strongest ever recorded. By September 2026, the temperature anomaly had already surpassed 3 degrees Celsius.
What does El Niño mean for me?
CEOAS scientists are turning discoveries about El Niño into real-world solutions for Oregon. By studying how El Niño influences drought, flooding, sea level change, fisheries and more across the Pacific Northwest, we’re helping communities anticipate challenges, strengthen resilience and develop solutions that support people, economies and ecosystems. Here’s what we know.
Forecasting weather
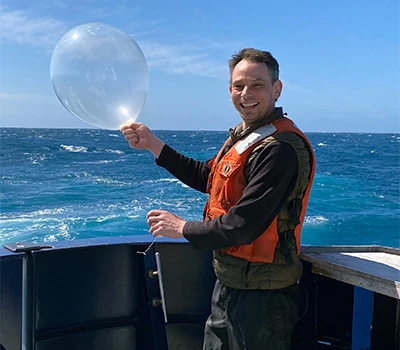
El Niño starts as a series of events line up in the warming Pacific. But what do those signals mean for our Oregon forecast? What about the warmer than normal ocean water in the Gulf of Alaska or the marine heat wave currently affecting southern California? Our climate scientists monitor how the ocean and atmosphere interact in a variety of ways to make sense of climate models and improve forecasts relevant to you.
Larry O’Neill, Oregon State climatologist
Listen to Larry give a Curiosity Collective talk >
Monitoring the ocean
Instruments deployed across the ocean track water temperatures, ocean currents, low oxygen zones, atmospheric pressure and winds, transmitting the information in near real-time to forecasters, scientists and resource managers. Through the high-frequency and sustained time-series data of one of those programs, the NSF Ocean Observatories Initiative, we can begin to untangle the causes, processes and consequences of ocean climate cycles. The NSF OOI Coastal Endurance Array has surface and subsurface measurements from moorings and gliders that can detect changes associated with ocean-climate phenomena off our Oregon and Washington coasts.
Ed Dever, principal investigator, NSF OOI Coastal Endurance Array
Read about Ed’s work deploying the Endurance Array >
Marine life
Upwelling is a process in which colder, nutrient-rich waters from deep in the ocean come up toward the surface, fueling productivity in marine systems. As trade winds weaken and warm ocean temperatures push east, that nutrient supply can decline and productivity decreases. We’re tracking how fish and shellfish distributions change up and down the coast.
Lorenzo Ciannelli, fisheries ecologist
Read more on Lorenzo’s work >
High water
Normal wind-driven waves move across the surface of the ocean, but a Kelvin wave – fueled by El Niño and moving with the pull of the rotating Earth – shifts the ocean’s internal temperature layers hundreds of feet below the surface. The wave moves north, pushing down on the thermocline, a hidden layer in the water column that separates warm surface water from cold nutrient-rich deep water. A deeper thermocline suppresses vital upwelling and may elevate sea levels by up to a foot along our coast. We’re monitoring the wave’s progress northward using autonomous gliders, research vessels and data arrays.
Kipp Shearman, physical oceanographer
Kipp explains Kelvin waves on OPB >


Coastal resilience
More heat in the ocean leads to more intense storms – and really big waves crashing into our coastlines. What does this mean for our coastal communities? We’re tracking that too. From increased risk of beach erosion to flooding, we’re learning how to better predict what and where problems will arise, to help communities with emergency response.
Peter Ruggiero, director, Cascadia Coastlines and Peoples Hazards Research Hub
Listen to Peter’s El Nino chat at Hatfield Marine Science Center >
More informational graphics coming soon!
El Niño in a warming climate
The world’s oceans have absorbed about 90 percent of the excess heat trapped around the Earth from human greenhouse gas emissions. And our planet has already warmed 1.5 degrees Celsius in recent times. As our global climate changes, El Niño events now occur in an altered environment.
These are uncharted waters.
We know heat transferring from ocean to atmosphere translates directly to warmer air temperatures. We expect to break more temperature records, have harsher droughts, more destructive rainstorms and intense floods. But the impacts of this 2026-27 El Niño is uncertain, as we’ve never experienced an El Niño of this magnitude before. Our scientists will gather data to better understand how these processes work and what stronger El Niños mean for our shared future.
Contact a CEOAS scientist
Larry O’Neill, professor and director of the Oregon Climate Service
Air-sea interactions, meteorology and oceanography, climate variability
Ed Dever, principal investigator, NSF Ocean Observatories Initiative Coastal Endurance Array
Melanie Fewings, professor
Coastal physical oceanography and meteorology
Lorenzo Ciannelli, professor, associate dean for graduate programs
Fisheries oceanography, spatial ecology, fish early life stages
Kipp Shearman, professor
Physical oceanography, coastal ocean, autonomous underwater vehicles
Peter Ruggiero, director, Cascadia Coastlines and Peoples Hazards Research Hub
Coastal geomorphology, coastal hazards, nearshore processes
Oregon State in the news
- Drought, heat wave leaves Mount Hood barren by early fall
(10/16/2026 OPB) - Super El Niño could bring Kelvin waves, increasing coastal flooding in Oregon
(09/18/2026 KPTV) - Climatologist explains what mega El Niño will mean for Oregon
(08/21/2026 Explore Oregon podcast)